
In the modern digital ecosystem, shifting from vanity metrics like raw pageviews to a holistic North-Star metric framework is essential for long-term media sustainability. To build an effective data strategy, publishers must align their analytics with four core pillars: user habit, real engagement, diversified revenue, and editorial quality. Relying solely on superficial traffic no longer scales; instead, media managers need a robust, event-based publisher dashboard driven by a Customer Data Platform (CDP). By quantifying deep reader loyalty and maximizing session ARPU alongside high-value content performance indices, sustainable publishing brands can thrive in an era dominated by algorithmic distribution and AI-driven search engines.
The Evolution of Media Analytics: From Volume to Value
For a long time, the main measure of success in digital media was quantitative indicators: pageviews and the number of unique visitors. This “click-based” model took shape during the boom of banner advertising, when revenue depended directly on the volume of traffic generated. However, by 2026, the content distribution landscape had changed dramatically. Algorithmic social media feeds, the emergence of AI agents, smart answers (SGE, SearchGPT), and recommendation platforms have blocked direct distribution channels. In these conditions, chasing gross traffic only leads to cash-flow gaps: random low-quality traffic does not monetize, while the cost of attracting it continues to grow.
The media industry is experiencing a deep crisis of vanity metrics. A pageview no longer means that the content was read or that the brand was noticed. It is being replaced by the concept of the North-Star Metric — a single target indicator that reflects the real value of the media product for the audience and is directly connected to the long-term financial sustainability of the business.
There is no universal North-Star metric for all publishers. Its selection is strictly determined by the business model:
- For subscription publications (Paywall/Subscription), the “North Star” is often the retention rate of the paying audience (Retention Rate) or the frequency of habit formation among non-payers as the main predictor of conversion.
- For ad-supported media, the focus shifts to maximizing session value (Session Value / Session ARPU) through deep engagement, not simply the number of clicks.
- For niche B2B resources, the key indicator may be the quality and depth of interaction with target (verified) professional segments.
To prevent the North-Star metric from turning into an abstract abstraction, it must be decomposed into manageable operational blocks. A sustainable analytics strategy for a modern publisher is built on four fundamental pillars:
- Habit: How often users return to the resource on their own, bypassing paid channels or random search. Formation of a stable core.
- Engagement: How qualitatively the audience consumes content. Measuring real attention time and session depth.
- Revenue: How readers’ attention is converted into financial flows, whether through programmatic advertising, native special projects, or direct subscriptions.
- Quality: An objective assessment of the editorial value of content, its long-term potential (Evergreen ROI), and its distribution qualities.
North-Star Metric
Media Value & Sustainability
Visit frequency, cohort retention, and building a loyal core audience base.
Attention metrics: core engaged time, recirculation, and completion rates.
Monetizing attention: maximizing session ARPU, paywall conversions, and yield.
Objective editorial value, distribution network authority, and evergreen ROI.
The transition to this four-dimensional model allows management to stop demanding meaningless “clickbait millions” from the editorial team and focus the team on producing content that generates loyalty and solid revenue.
Habit: Building Regularity and the Audience Core
In conditions where platform algorithms can cut off external traffic at any moment, the publisher’s main asset becomes the audience core — users who come to the site directly and do so regularly. Habit formation shifts management’s focus from volume (“how many people visited us this month”) to behavior patterns (“how often they return”).
Why Frequency Matters More Than Volume
Traffic volume often masks the real state of affairs. A publication may show millions of unique visitors thanks to a viral hit in Google Discover, but if 95% of these users leave forever after 30 seconds, they bring no long-term value to the business.
Visit frequency is the main indicator of the health of a media product. It is the regularity of interaction that reduces customer acquisition cost (CAC) and lays the foundation for both the advertising and subscription models. A loyal core creates stable “base” traffic that does not depend on the whims of third-party platforms.
The LTV-Predictive Habit Metric: The “3 Visits per Week” Rule
To quantify habit, leading global publishers use an approach based on predictive analytics (LTV-predictive habit). Instead of abstractly tracking returns over a month, analysts look for a tipping point — a specific visit frequency over a short-term period after which a user is highly likely to become a regular reader or paying subscriber.
The industry has adopted the conditional “3 visits per week” rule (or custom metrics such as the RFV index — Recency, Frequency, Volume):
- Recency: When did the user last visit?
- Frequency: How many of the last 7 or 30 days did the user spend with us?
- Volume: How much content did the user consume during this time?
Once the analytics team finds this critical consumption norm (for example, for a local media outlet it might be 5 visits per month, while for business analytics it might be 3 visits per week), this metric becomes an operational KPI for the product team. The task is to “pull” the hesitant user up to this threshold.
Technical Markers of Habit Formation
To track habit formation at the system level, a modern publisher must configure tracking of the following metrics in its CDP (Customer Data Platform):
- Cohort Retention Rate: Dividing users into groups by the week or month of their first visit and tracking the share of those who continue to return.
- Direct-to-Proxy Ratio: The ratio of direct visits (Direct, bookmarks, URL entry) and visits through proxy channels (newsletters, push notifications) to total traffic volume. It indicates brand strength.
- Micro-conversions into retention channels: The share of users who performed target actions that “bind” them to the media. These include:
- Subscribing to thematic email newsletters.
- Granting permission to send browser or mobile push notifications.
- Creating a personal account (registration).
- Downloading the mobile application.
Applied takeaway for the manager: Habit formation is not the editorial team’s task; it is the product team’s task. The editorial team creates high-quality meaning, but it is product triggers (a timely push notification, a customized evening newsletter, a convenient bookmark interface) that turn a random click into a daily ritual.
3. Engagement: Measuring Real Attention
If Habit answers the question of how often the reader returns, then Engagement measures what happens inside the session itself. For a media manager, engagement is the main filter that separates random clicks from real value. Content that holds high-quality attention not only monetizes better but also receives priority in smart search algorithms (SGE, SearchGPT).
The Shortcomings of Standard Time on Page and the Shift to Core Engaged Time
Most standard analytics systems (including the basic setup of Google Analytics 4) measure Time on Page using the principle “timestamp A minus timestamp B.” If a user opened an article, stepped away to pour coffee for 10 minutes, and then closed the tab, the system will count those 10 minutes as “high engagement.”
In advanced media analytics, this indicator has long been replaced by Core Engaged Time. This metric records the time when the user performs real actions on the page:
- Whether the tab is in the active browser window (focus).
- Whether scrolling is happening (and at what speed).
- Whether the mouse cursor is moving or taps are occurring on a smartphone screen.
- Whether embedded video or audio is playing.
If activity stops for more than 3–5 seconds, the Core Engaged Time counter pauses. It is this “clean” attention time that is an honest metric of content quality.
Completion Rate and Session Depth
To assess the structure of content consumption, management must track two interconnected indicators:
- Completion Rate: The share of users who scrolled to the end of the material (or to the end of the main text area, excluding comments and the footer). A low Completion Rate together with a long Core Engaged Time often indicates that the text is “dragged out” or difficult to process, while a high rate together with a short time indicates light, scannable content or... clickbait that disappointed the reader.
- Pages per Session: The average number of pages viewed by the user during one visit. Growth in this indicator is a direct sign that the media product has managed to shift the reader’s attention from a random piece of material to exploring the entire resource.
Product Metric: Recirculation Rate
One of the most important operational metrics for the editorial team and UX designers is Recirculation Rate. It shows what percentage of users moved to another page on the site after reading the current article instead of leaving the resource (Bounce).
Recirculation Rate=Total number of visitors to this page/Number of users who clicked internal links×100%
A high recirculation rate is achieved through three factors:
- Contextual internal linking: Links within the text to related topics and entities.
- Smart recommendation widgets: “Read also” blocks powered by personalization algorithms.
- Editorial special projects: Topic Hubs that combine a series of materials into one chain.
Applied takeaway for the manager: Engagement cannot be stimulated artificially without losing quality. Management’s task is to give the editorial team tools (for example, scroll heatmaps and real-time recirculation reports) so that authors can see at which paragraph the reader loses interest and can quickly adjust the structure of longreads.
Revenue: Connecting Audience Metrics with Financial Metrics
Habit and engagement metrics have no meaning if they do not convert into the financial sustainability of the publication. The task of the modern media manager is to bridge the gap between editorial KPIs and business indicators by connecting reader behavior with specific financial flows. The monetization strategy depends directly on the chosen business model, but in both cases the key factor is the value of the user session.
Advertising Model: From CPM to Yield per Mille (YPM) and Session ARPU
In the traditional advertising model, efficiency is assessed through CPM (cost per thousand banner impressions). However, this indicator is isolated from the user’s overall behavior: it measures the value of a specific ad placement, not the reader.
For a comprehensive assessment of profitability, publishers are moving to YPM (Yield per Mille / Revenue per thousand sessions) and Session ARPU (Average Revenue Per User per Session). These metrics account for all revenue generated by the user during a single visit, including programmatic advertising, native integrations, and video impressions.
Session ARPU=Total number of sessions for the same periodTotal advertising revenue for the period
The connection between engagement and revenue is obvious here: if high Recirculation Rate and deep scrolling increase session depth from 1.2 to 2.5 pages, then Session ARPU grows proportionally, even if market CPM remains unchanged. Management receives a tool that proves: quality content directly increases advertising revenue.
Subscription Model (Paywall): Conversion Potential and Churn Prevention
For publications operating under a paid subscription or freemium model, analytics must solve two strategic tasks: attracting new subscribers and retaining existing ones.
- Conversion Rate by Story: Analysis of which specific materials or thematic sections most often become the “closing point” of the paywall, prompting the user to subscribe. This allows the editorial team to invest resources in high-converting types of content (for example, exclusive investigations or deep analytics), rather than in routine news briefs.
- Churn Mitigation Metrics: To retain the paying audience, the analytics team tracks critical declines in activity. If a subscriber who used to visit the site 4 times a week reduces frequency to 1 visit every two weeks, their profile in the CDP is automatically marked as “churn risk.” At that moment, the product must respond with a personalized email newsletter or push notification featuring a selection of the best materials based on the user’s interests.
Balancing Commercial Load and User Experience
One of the main mistakes in media management is aggressive monetization at the expense of the reader experience. An excess of “heavy” advertising formats (Pop-ups, Interstitials, autoplay video with sound) increases short-term revenue but catastrophically reduces Core Engaged Time and Cohort Retention. Users either go to competitors or turn on AdBlock.
Progressive publishers use the Commercial Load Index (Ad Density / Clutter Index) to find the golden ratio. The manager must track the point at which adding another ad block begins to reduce the overall value of the session because the reader leaves the page early.
Applied takeaway for the manager: Media revenue is a derivative of trust and attention. Setting up end-to-end analytics that combines data from ad servers (for example, Google Ad Manager) and subscription modules with a behavioral CDP makes it possible to make decisions based on ROI data for each specific author, section, or distribution channel.
Quality: Quantifying Editorial Value
The hardest challenge for a media manager is to translate the concept of “journalistic quality” from the language of emotions and subjective assessments into the language of hard data. In an era when AI models can instantly generate tons of mediocre rewrites, it is unique, deep, and high-quality content that becomes the main factor of survival. Moreover, modern search engines and AI algorithms (such as Google E-E-A-T and SearchGPT) explicitly prioritize original sources and expert content.
How to Measure Data Quality Without Subjectivity: Content Performance Index (CPI)
To make quality assessment objective, publishers implement comprehensive scoring models. One of the most effective practices is calculating the Content Performance Index (CPI). This is a composite metric that assigns each material a score (for example, from 1 to 100) based on a combination of behavioral factors.
The CPI formula is individual for each publication, but it is always based on a weighted balance of metrics from the previous sections:
CPI=(w1×Core Engaged Time)+(w2×Completion Rate)+(w3×Recirculation Rate)+(w4×Micro-conversions)
Where w1, w2, w3, w4 are weighting coefficients whose sum equals 1. For example, for an analytical publication, the weight of micro-conversions (newsletter subscription) may be 0.4, while for a news publication, priority is given to recirculation.
Implementing CPI allows management to fairly evaluate editorial work: a longread that took a week to write but gathered 10,000 deep reads and brought in 5 subscriptions will receive a higher quality index than a routine breaking news item that collected 100,000 fleeting clicks thanks to a hype-driven headline.
Distribution Metrics: Organic Reach and Trusted Sharing
Content quality directly determines the nature of its distribution. If the material is truly valuable, its distribution acquires qualitative markers:
- Visibility in semantic search (entity SEO & GEO): Inclusion of the article in AI answer blocks (AI Overviews in Google, SearchGPT answers) as an authoritative source. This is algorithmic recognition that your brand and authors have expertise in the given topic.
- Trusted sharing (Earned Distribution): Forwarding the material in closed professional communities, corporate messengers (Slack, Telegram), and industry platforms. Unlike the standard cliché of “sharing on social media,” this type of sharing is difficult to track directly (it often goes into Dark Social), but its footprint is visible through a sharp increase in direct visits (Direct) to a specific URL.
- Depth of citation: The number of natural backlinks from other media and industry experts using your material as the original source.
Long-Term Material Value (Evergreen ROI) Versus Short-Term Spikes
Quality content has a long life. Media management must divide the editorial portfolio into news content (Breaking News) and evergreen content (Evergreen Content).
The Evergreen ROI metric is used to assess evergreen materials. It measures how effectively an article continues to generate Habit, Engagement, and Revenue months (and even years) after publication without additional distribution costs.
- Low quality: The article produces a strong traffic peak on the first day, and then the traffic chart drops to zero forever.
- High quality (Evergreen): After the initial spike, the material reaches a stable plateau and attracts the target audience from search every day, regularly monetizing each session.
Applied takeaway for the manager: Quantifying quality removes internal conflicts between the editorial team and the commercial department. When the team has a transparent tool like CPI, journalists understand that they are valued for retaining attention and audience loyalty, while management sees how investments in complex, expensive materials turn into long-term intangible and financial brand assets.
Checklist for the Media Manager: How to Set Up a North-Star Dashboard
The transition from chaotic tracking of standard metrics to management through the North-Star system requires restructuring both the technical infrastructure and the company’s internal culture. The implementation process consists of four sequential steps.
Step 1. Technical Audit and Event Collection (Event-Based Analytics)
Modern media analytics cannot rely on standard counters that record only pageviews. You need to rebuild the tracking system around recording specific user actions (events).
- Configure custom events (Custom Events): Instead of basic time spent on site, integrate JS scripts to track real interaction (active tab focus, mouse movement, page-by-page scroll depth).
- Implement micro-conversion logic: Every action that leads to retention (clicking the “Subscribe to newsletter” button, successful form submission, permission for push notifications) must send a unique event to your analytics system.
- User identification: Configure end-to-end User ID tracking to correctly connect sessions of the same person across different devices (desktop, mobile browser, application).
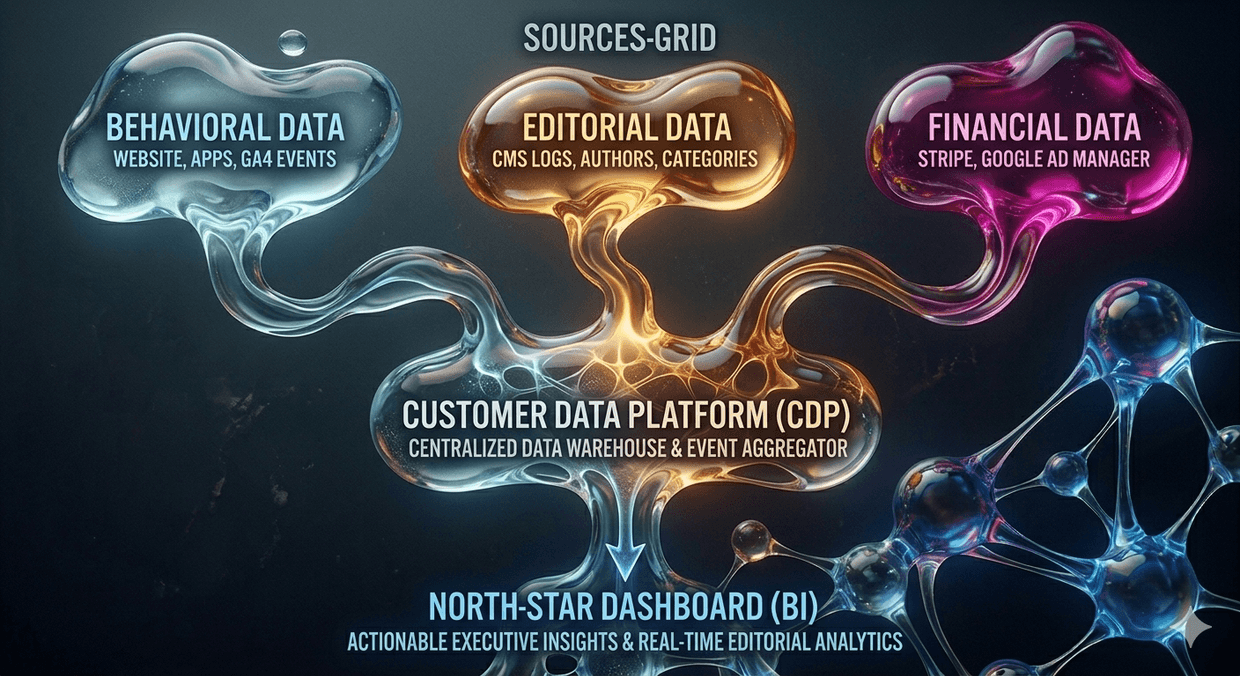
Step 2. Data Integration into a Single Repository (CDP / Data Warehouse)
Data on user behavior, editorial metrics, and financial indicators often live in different, disconnected systems. Management’s task is to unify them.
- Connect the CRM/Paywall and ad server (for example, Google Ad Manager): This will allow you to calculate accurate Session ARPU and see the real commercial value of audience segments.
- Enrich data from the CMS: Send article metadata to the analytics repository — author ID, section, text length, number of entities (brands/people), and publication date — for correct calculation of CPI and Evergreen ROI.
Behavioral Data
Editorial Data
Financial Data
Customer Data Platform (CDP)
Centralized Data Warehouse & Event Aggregator
North-Star Dashboard (BI)
Actionable Executive Insights & Real-time Editorial Analytics
Step 3. Visualization and Creation of Role-Based Dashboards
The composite North-Star metric must be decomposed and presented to different teams in an interface convenient for them (through BI tools such as Looker Studio, Tableau, or specialized media panels such as Chartbeat / IO Technologies).
- Dashboard for C-level (top management): High-level trends. Dynamics of audience core changes (Habit), overall Session ARPU, subscriber retention, and fulfillment of the North-Star financial plan.
- Dashboard for the editor-in-chief and product managers: Recirculation rate by section, average Completion Rate, real-time engagement anomalies, and new distribution patterns.
- Interface for authors: A simple screen, not overloaded with financial terms, showing the personal Content Performance Index (CPI) of articles, readers’ active attention time, and engagement in Evergreen materials.
Step 4. Changing KPIs and the Decision-Making Culture
The most difficult stage is to stop rewarding the team for “empty” pageviews.
- Revise the motivation system: Tie bonuses for authors and editors to qualitative indicators (growth in Core Engaged Time, audience retention within the section, high CPI), not to gross traffic.
- Regular content portfolio reviews: Once a month or quarter, audit “evergreen” content. Based on ROI data (Evergreen ROI), make decisions about manually updating and improving old high-quality articles instead of generating dozens of short-term news items.
Conclusion
In an era of algorithmic instability and AI search, the sustainability of the media business rests on the controlled attention of loyal readers. Implementing a North-Star framework that balances habit, engagement, quality, and revenue allows publishers to move away from a destructive dependence on random traffic. Understanding the real value of each session turns media from a click-production factory into a protected, high-margin, and authoritative business.
FAQ: Transitioning to a North-Star Metrics System in Media
1. Why replace familiar Google Analytics 4 (GA4) and Yandex Metrica with a custom CDP?
Basic counters were created for e-commerce and classic service websites; they think in terms of “session” and “purchase conversion.” For media, attention dynamics matter. Standard GA4 out of the box calculates time on page incorrectly for media tasks and cannot automatically group content by complex editorial tags or authors, or calculate recirculation rate in real time. A CDP (Customer Data Platform) collects raw behavior logs and combines them with data from your CMS and commercial department, providing a multidimensional business picture.
2. If we stop chasing Pageviews, won’t our advertising revenue fall?
On the contrary, it will become more stable. Advertisers and programmatic platforms increasingly value viewability and context. By focusing on Engagement and recirculation, you increase the number of pages viewed by one loyal user in a single session. As a result, your total inventory (the number of banner impressions) may even grow, but it will be high-quality, expensive inventory with a high CTR, not random bounces.
3. How should we explain to the editorial team and journalists what CPI is and why their KPIs have changed?
The main argument for authors is fairness. Explain to the team that the new system protects them from the “dictatorship of clickbait.” Previously, the author of a complex investigation would lose to a colleague who rewrote a viral story about cats and collected views. The Content Performance Index (CPI) proves to management that a longread that held the attention of 5,000 professionals and prompted them to subscribe to a newsletter is more valuable to the business than 50,000 random visits to a “hype” headline.
4. What ratio between news and evergreen content is considered healthy?
For most socio-political and business media, the golden ratio is considered to be 70/30 or 60/40, where the larger part is the operational flow (news, opinions, the agenda), and the smaller part is deep Evergreen materials (instructions, guides, special investigations, explainers). At the same time, in the structure of long-term revenue, Evergreen content, thanks to high Evergreen ROI, can generate up to 50–60% of all profit from native advertising and subscriptions.
5. How long does it take to implement a North-Star dashboard from scratch?
On average, the process takes 2 to 4 months.
- Month 1: Audit of current analytics, development of technical requirements for developers to mark up custom events (scrolling, focus, clicks) in the CMS.
- Month 2: Setting up data collection into a single repository, testing the correctness of User ID and article metadata transfer.
- Month 3: Designing interfaces (dashboards) in a BI system for different departments, deriving test KPIs, and training the team.